Good news! Last year, I’ve become an actual engineer and I earned my Bachelor of Science. Wohoo. What do I do with it now? Well, the masters of course. I’m currently leaning more towards academia even though I initially wanted to head straight into industry, which was partially why I chose chemical engineering as my field. But I was lucky to have the best professor of my university to supervise me and give me confidence. He is a physicist speacialised in material science and that’s what I worked in for my thesis as well. It’s damn cool and all, but I won’t go into any details here. I just wanted to let you know where my life is at this point in time.
That was actually at the beginning of last year. Where did all of the other time went? Honestly, no idea. It flew past me like never before. But it was great. The years before that were really dull and uninteresting, mainly due to COVID-19. Then, even though everything went kind of back to normal, I was practically done with the university courses and only my bachelor project was left. So I was often at home or at work, doing said project. It was a great time, no doubt, but I was mostly doing things by myself. After I graduated, or to be more precise, while I was still writing my thesis, I started with the courses for the masters degree. It would have been far too much to attend all lectures, so I skipped most of them but still, somehow, in hindsight I have no idea how, took most exams of that semester. In the second semester (which just finished), I could focus on uni a lot more and I had tons of projects and lab courses to complete for it. It was a great time, possibly the greatest I had during my time at university so far, but the quick transition from lazily chilling at home with almost nothing to do, over to writing a thesis (not to mention doing the experiments for it) and learning for exams at the same time, and eventually to working two days a week, keeping up with six difficult lectures, working on several lab tasks, giving a tutorial in physics for freshmen every week and preparing and giving my first own lecture all within one year was extremely exhausting.
I could have postponed some of those time consuming things, and that would have made the time far less dense, which is good, but also less surprising for me. It somewhat proved my capabilities and disproved that my mental limits are reached quicky. You need such a pat on your shoulder once in a while telling you that you’re actually good at something. So here I am, renewed with solidified self-confidence.
In the little freetime I had, I’ve read the book “This is How You Lose the Time War”1 by A. El-Mohtar and M. Gladstone, and with being just short of 200 pages, I’ve done it pretty quickly. It’s categorised as science-fiction (no surprise here), but also as romance. Latter of which really turns me off in books, so I avoided this particular one for some time. Even though it was published in 2019, a local bookstore still had it on it’s shelf recently and I figured that I should give it a try nevertheless. The reviews were quite positive.
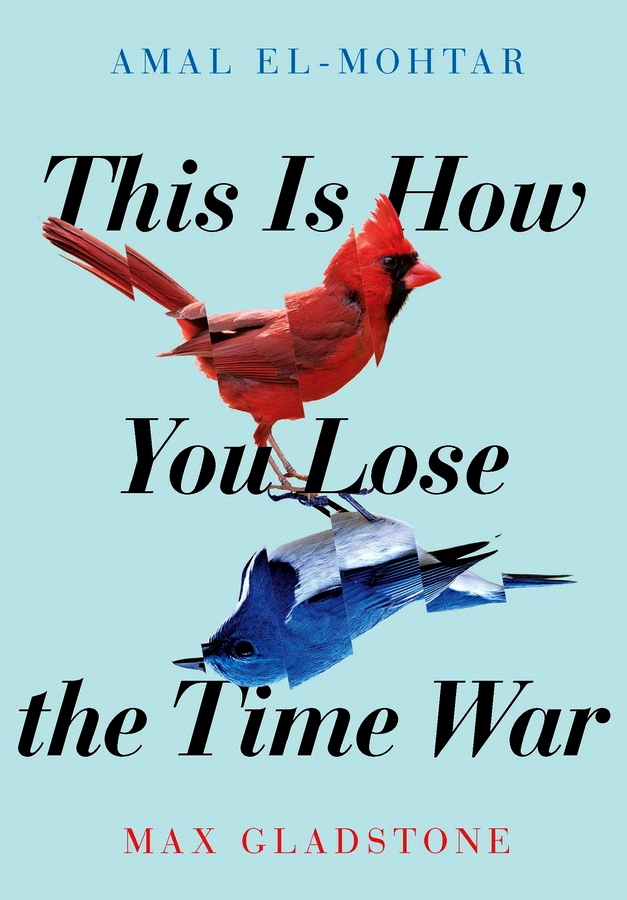
And hell, indeed, this blew my socks off and made my eyes wet simultanerously! I won’t review it here, but: You will love it even if you hate romance. You will still love it even if you hate science fiction. But what you should like, I guess, is language. I had no idea how incredibly strong a single sentence could be if it was crafted to perfection2. This book must be it, the one with the most perfectly crafted writing in it. You have to read it. It’s not that you learn a lot of lessons, question life or whatever, no, it’s simply perfectly written. You have to read it for the sake of experiencing the power of utter love through this incredible prose.
To cite emmareadstoomuch3:
I tried to trick myself into stating all the ways in which it is amazing, but as always I got overwhelmed and ran out of words to describe it. – Emma
So I better not try the same here. But one thing is certain for me. If this book will not become a classic to read 100 years into the future, I’ll be turning in my grave.
I’ve been using Obsidian for quite a while now to write notes, project plans, drafts for documents, collect sources and other useful information. It’s really good for that purpose and like how it’s purely based on markdown files that can link each other and other files or resources. Super useful and far more organised than the typical note-taking app that isn’t compatible with things outside what it’s designed for4.
Last year in September, I figured that I somewhat want to write a diary. Not the kid-in-school I-like-spaghetti and here-are-some-flowers-for-mom type of diary, and also not the restricted type that you keep in a worn booklet someone steals from you oneday. Rather something more interactive, interconnected and explorable. I figured, Obsidian would be a cool thing to try for this. The idea is to write daily entries as well as meta entries that serve simple collection of information which is not bound to a specific time and interconnect them as it happens in my mind during the day. Say for example, I do a trip to a city I haven’t been to. I might write things about the trip, things I’ve seen or have done, which museum I’ve visited and how I liked it, you name it. Then I add another file specifically for that city, and in it, I put some interesting to know facts that I’ve learned about it. For example how old the city is, which famous person lived there, a memorable building, etc. That famous person or building gets another file and so on. While writing about such one thing, I can link to its respective file where more information can be found. Pretty much like a wiki. But it wouldn’t be like any online wiki because I write it myself from my perspective; how I like things, what my opinion is about them, which people I met how and when and what I learned from them.
So I’ve done just that for a while now. I missed some days or even weeks and didn’t write anything, but why care? As long as I enjoy doing it, I do it, and when I don’t, I don’t. What a stupid sentence. Well, whatever. Coolest feature of Obsidian5 is the built-in graph-view which displays all your files and draws the references you made within them as connections. So here you can see what my life looked like during the past couple of months:
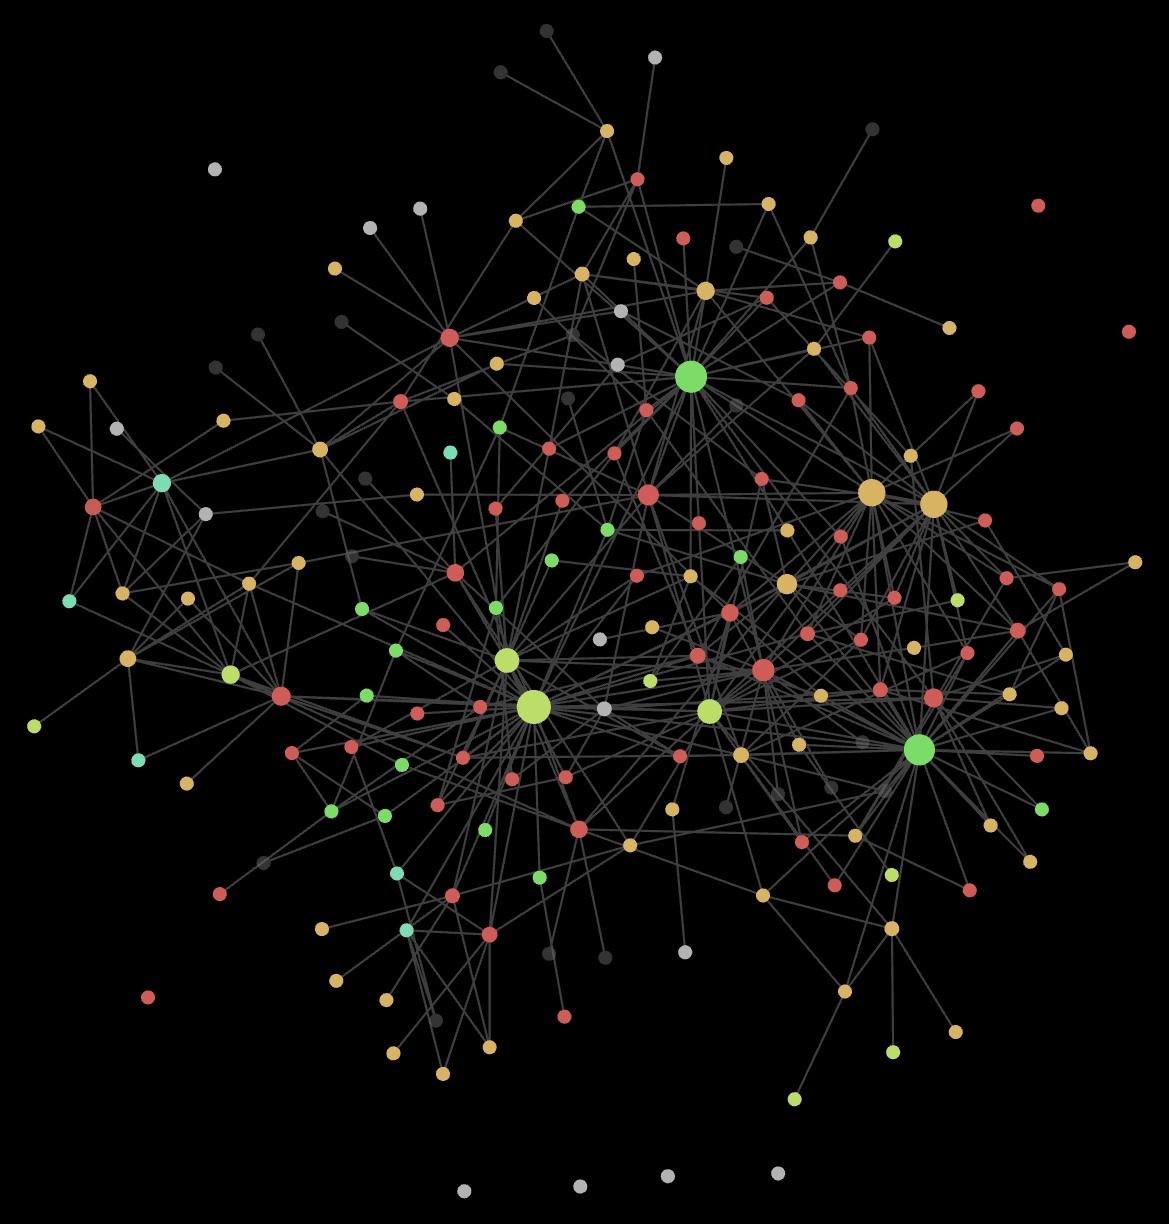
In that graph, the colours represent the folder each respective file is in.
I’ll explain it a bit:
Red are the diary entries – as you can see, there are less points than days since September, as I’ve skipped quite a few.
Still, the files are named like 2024-03-14.md
, just as you would start a new page and place a heading in a “standard” diary notebook.
In that entry, I can link to other files.
Say I want to mention London as a city I visited; then I would simply type [[London]]
and it would automatically link to the file London.md
which can be placed elsewhere and also contain similar links.
The size of the points represent how many of such connections there are to other files.
Cities are shown in lime. The largest point is the city I live in, and right next to it is where my family is at home. During the winter and christmas holiday, I was there for a few weeks. Locations are green. Those can be many things for me, like districts or streets in a city, buildings, parks, or other places you can visit. In the lower right corner is my university for example and the other large point at the top is where I work.
Now, the most interesting part (for me): Orange points represent people. They are mostly people I’ve actually met on a day, but I’ve also added a few which I spend some time with – through their book which I’ve read, for example. The two large ones on the right are close friends that also visit my university and coincidentally work at the same place. So we naturally spend a lot of time together and I mention them pretty often in my daily entries. The slightly separated cluster you can see on the far left comes from people of the local photography community. We have met a few times on the street or in gallery exhibitions (such events are blue, by the way). I wish to see them more often though as those activities are not only fun and relaxing but evidently, as you can see by the visible separation from the rest, let me escape the everyday chaos.
I think this graph view is a really nice way to visualise what I do, where I do it and with whom. This is probably just the start – imagine looking at 10 years worth of interconnections!
So there we have it. I hope you have it as well, the nice time to live in and appreciate and if not, maybe read a little book to cheer you up. The world is shit and unfair, but remember, we can shape it.
Goodreads page of “This is How You Lose the Time War”. ↩
One of my favourite sections is probably this: “Flowers grow far away on a planet they’ll call Cephalus, and these flowers bloom once a century, when the living star and its black-hole enter conjunction. I want to fix you a bouquet of them, gathered across eight hundred thousand years, so you can draw our whole engagement in a single breath, all the ages we’ve shaped together.” Even as I’m copying this from the book right now, my tears are knocking on the door again. ↩
Emma’s review of the book. ↩
It’s weird and probably personal to me. Whenever I find a new and innovative app for taking notes, I initially like it, but eventually forget about it again. In order to actually use it over a long time, the solution needs to be so omnipresent, straigtforward and simple, that it becomes natural to remember where you noted something. I sometimes have a slight feeling that I wanted to remind myself of something, wanted to check someting later again or use a specific value for something. My current solution is Apple’s note app where I don’t organise anything and have literally just two files. One as a grocery shopping list where I keep all entries and just tick-on when I just bought it or tick-off when I used it up and need it again. And a second one for everything else. It’s a crazy mess, but the only way that works for me. Everything else I’ve tried does not, and so for the stupid reason that I simply forget that the note file even exists. I would need an additional catalogue to find where I noted what, but when noting where I noted something, I could just as well note it directly there – and that’s what I do in the one messy file. I hope it makes sense what I just wrote. Nevertheless, Obsidian somewhat sneaked into this and proved to work for me to a degree. Definitely not for the purpose I use Apple notes, but for a more meta note- and idea-keeping system. It didn’t replace anything for me, but rather provides an additional way of dumping my brain. ↩
Obsidian has many other cool features, some achievable through community plugins and some inherited from the plain markdown format. Embedding photos easily without typing long links manually, PDFs can be embedded (it’s possible to scroll through them within the rendered markdown), even LaTeX formulas are rendered, GPX-tracks can be displayed on a map, hastags used inside the text, and the search function all work super well. Listing all backlinks that point to the current file, and the file tree structure that is flattened in the background for easily linking files without any paths make the app really solid. ↩
Quirrenbach introduced himself as a music composer who has put himself into cryosleep and travelled many lightyears across solar systems to visit this legendary planet called Yellowstone to compose a symphony about it’s glamourous utopia he was told about. When he finally arrives, he finds a planetary system rotten by an alien virus that infected all materials containing advanced nanotechnology. It transformed the entire city into a swollen chaotic metal-organic jungle with a completely broken society and only primitive, mostly mechanical technology from an age long ago. Quirrenbach is shocked and worried what to do but then figures he must continue and now create a tragical piece from what he discovered.
This is told to Mirabel on the go and not elaborated in more detail, but thinking about it and imagining the grand scale of his musical masterpiece he so deeply must have dreamed about and now vanished into nothing is so breathtaking for me. If ever we as humans travel deep space, and a composer that devotes his entire life into capturing the beauty of planets and stars as musical pieces, it will be the single most beautiful thing so astonishing that we can’t possibly imagine it yet.
I belive that music and only music is powerful enough to accomplish this. Even though I am strongly influenced by Ansel Adam’s quote, I think on a scale greater than us individual beings, silence, and even photographs are not adequate.
When words become unclear, I shall focus with photographs. When images become inadequate, I shall be content with silence.
– Ansel Adams
But if stars and planets are the abouts, silence shall be filled with melody.
– extended by me
If you want to get a sense of what is possible with music, you should listen to the compositions by James Paget2 or Keith Merrill3, Thomas Bergersen’s Humanity project4 and Neurotech’s cyber-industrial metal5. Those, I think, are the closest you get to what Quirrenbach was about to create.
For the sake of completeness, I should add the following:
Apart from all this, I found Chasm City to be among the greatest novellas I have read. It’s a very personal story taking place in a universe that is—well an entire universe. Reynold’s Revelation Space books have such a scale and are yet filled with so many senseful and raw details forming a complete histroy6 of humanity’s future before your eyes that it is hard to believe it was creatively created. Contrary to the dystopian and brutal nature of this imagination, I somehow hope it will become true.
Chasm City by Alastair Reynolds. If you’re interested and want to read it, I highly recommend that you start with the first part of the series, Revelation Space. You’re going to be hooked! ↩
James Paget on bandcamp; The Wonder of Gaia is particularly beautiful. ↩
Awakening and Inspiration by Keith Merrill are breathtaking. ↩
Humanity by Thomas Bergersen is a series of seven albums that is still in the writing, one through five are already released. ↩
Particularly In Remission or Symphonies by Neurotech. ↩
Well, I’ve done experiments the other day – again, with renders of strange attractors – and I focussed on those found by J.C. Sprott in 1994. He discovered 19 distinct cases of the most simple chaotic attractors possible, some of which I have rendered artistically here.
Because Sprott’s work is pretty significant, I wondered why I couldn’t find much resources about them online, comparisons of the attractor’s features for example. Obviously, there has been done extensive scientific research on the systems (more than 800 articles cite the original publication), but even among those that do direct analysis most of the times do it on only one or two of Sprott’s cases. I wanted to change that, though, as I am no mathematician, my approach to this is not to look at the formulas, but at the visuals.
Until now, I only had time to take a look at the cases A, D, and G; and afterwards, I came up with a simple but very elegant way of rendering 3D attractors with only a line that still gets a three dimensional look by varying the line’s thickness and brightness1. You can find that technique used in stereographic animations I show beneath the usual renders and in my past blog post here. I now improved it a bit and created still images of all of those 19 Sprott attractors.
And here is the collage I made with them:
Since I have printed the Nosé-Hoover attractor back in the day for my own wall, I have thought about offering something to you dear readers. As I explained, I find it a pity that nowadays almost all digital images will only accumulate virtual dust, never become physical – and I want to change that not only for myself, but also for you, who will definitely enjoy the beautiful chaos of the attractors even more when it is printed on actual paper.
So, here it is, with oh-so many products, my shop:
PS: If the poster is a little too much for you, I have also made postcards from some of the Sprott cases, which I’d be happy to send you in return for a small donation.
The wallpaper-style renders I have done before do reward you with a realistic look and great detail, but adjusting attractor model, design the set around it, model supporting objects and fine-tune materials and the lighting setup takes a lot of time – not to mention the actual time it takes to ray-trace the scene during rendering. No doubt, I will continue creating these, but for this project, showing the raw attractors with a look free from any distractions worked perfectly. The “Rendering” I’m doing here is really quick and I only have to adjust parameters like orientation, simulation speed and framing when moving to a new attractor system. ↩
I understand that a basic product which wants to achieve wide accessibility has to have a consistent UI that never changes much and has to be as flat as possible without any niche functions not everybody would use frequently – because those would distract and confuse. But keeping the UI as plain as possible results in a boring appearance and a very dull feeling when using it. That’s what I dislike so much about Material Design by Google. It is so much optimised to work in every use case that it is by far the worst set of icons, colours, button designs and UI elements I have seen yet. I would rather use a desktop designed like macOS X Cheetah than one that follows the Material Design guidelines.
And Chromium is also such a product that is so hardly optimised for everyone that it is very badly optimised for each individual user.
But I’m not grandma Dorothea who never used anything else than Chrome (installed by her grandson who studies computer science which she misinterpreted as service technician) and when suddenly a second tab opened, she is screwed and doesn’t know how to navigate anymore because it now looks slightly different. I’m not somebody who doesn’t know how to use a computer.1
Now, what works better for me?
I tried many things, but in the end stuck to the good old Firefox, which I modified so heavily that it neither looks, nor feels like Firefox. It’s so different from anything else that probably nobody else knows how use it. But nobody else has to.
And because I looked at every single component to find out how I could modify it to make it better, I know exactly how it functions, and only that matters. Because of that, I also don’t have to write down how it works and since it’s my computer, I don’t have to explain it to anybody. Although I’m doing precisely that right here.
So, this is how my Firefox looks like:
What you’ll find is that the tabs are on the left and in a vertical list, that they group into a tree structure, that there are no close buttons, no scrollbar, not even a button for opening a new tab. In the address bar, there is no reload button, no back and forward buttons, no bookmarks, no title bar, no row of several extension icons.
But I can still access all of those functionalities I have hidden from the UI: The tab close buttons are hidden on the favicon. I can click the icon of any tab, and it closes. No need to scroll in a horizontal row until I find it, open it so that the website loads and reveals the close button on the right of the tab. I don’t need a scrollbar, because I know it’s a scrollable list. New tabs can be created with ⌘+T; I have always done it that way and don’t need a button for it. Tweaking some settings also places the newly opened tab next to the currently active and not 68 tabs farther down the list.
Same with reloading, which can be done with ⌘+R and back and forward navigation, which I do with the mouse gesture or ⌘+⮂ and ⌘+⮀. Bookmarks are in the tab list as a second page. This makes way more sense to only use them there as there is already a sidebar that occupies space and doesn’t open a new one which causes layout shifts etc. But most times I don’t even need to open the bookmarks list, as the address bar already searches through them.
Speaking of the address bar, the font size of the URL is also reduced to fit even more of it. Most extensions I have installed are passive, and they can rest in the overflow menu. Removing all the unnecessary buttons from the address bar makes it possible to display far longer URLs than what’s possible in other browsers (especially Arc) and keep the profile very thin at the same time. Inside the list of search results, Firefox always shows a section with icons for other search engines and an entry to search with the second most used engine. I removed those, as well as the prompt to log in for account synchronisation you’ll find in the burger menu.
As the tab side bar is collapsible with a shortcut (set it to ^+⌥+B) and the remaining UI is only the minimal address bar and a very large area for the website, I don’t even need to go into full-screen mode anymore when I watch films or streams. Also, the tree structure is produced when opening links from one page that open in a new background tab. I almost always do that by holding ⌘ when clicking a link. Tabs can also moved into groups manually.
So how have I done it?
Follow this guide to reduce the height of the default tab bar by enabling compact mode.
The sidebar listing the tabs comes from Sidebery. It has a massive amount of settings that are actually useful and worth to fully search through. If you want to start with my settings, you can import them below the help section in Sidebery’s settings. Customising the looks of it is easy to do with the provided styles editor. This is the CSS I added:
In order to modify the CSS of the browser itself, the stylesheet userChrome.css
has to be read by Firefox2.
To enable it, navigate to about:config
(enter it into the address bar) and search for the setting toolkit.legacyUserProfileCustomizations.stylesheets
(copy that into the search field).
Double click onto the resulting setting element to set its state from false
to true
.
Now, find the location for the CSS file; on macOS, at ~/Library/Application Support/Firefox/Profiles/
there are several folders starting with a random ID, followed with the user profile.
You should move into the one ending in .default-release
and create a new folder named chrome
if not present already.
Inside there you can finally create the file userChrome.css
and enter your custom code3.
Changes do not apply in real-time and you have to restart Firefox to apply the changes.
Mine is this:
The arrangement and visibility of the other buttons in the new toolbar can be dragged and removed after you right click on the bar and go to customise menu (where you have previously chosen compact mode). I removed everything except the screenshot button (because I otherwise forget that Firefox has its own screenshot tool) and very few extensions I often want to look at or click on.
And that’s it! I now have the perfect browser that protects my privacy far more than any default browser would4, has the most space efficient UI out there, and can only be used by myself (and you, who read this). Believe me, it’s a far greater experience to surf and research now. Maybe, this little guide helps you to realise, that browsers don’t have to be the most boring piece of software you’re using every day, that you don’t have to throw your private data at Google just to browse the internet, and that you don’t have to fear to customise your computer to an extend that would confuse other people. Go ahead, and figure out how to make your browser better!
This blog from over 9 years ago will never loose relevance. ↩
You might argue that Firefox is in active development and CSS selectors and other functionalities likely change in the future and break your modified version. Yes, that will totally happen. But as it is only one CSS file I can simply rename to let it be ignored by Firefox and the tab sidebar is only an extension I can deactivate, it is very quick to get back to the default browser. ↩
Here is a very extensive list of things you can do with userChrome.css
and other hidden tweaks. ↩
Thanks to the extensions Privacy Badger, Decentraleyes, NeatURL, uBlock Origin and Request Control. ↩
I have categorised them roughly:
If you find any book missing in this list, please share it in the comments!
A very good historical summary of what it took to discover chaos, study chaos and explain chaos. In Chaos, James Gleick not only describes what happened back then, but lets you discover the simply mind-boggling science yourself.
Steven Strogatz is an exceptionally good lecturer at Cornell University as well as a very good writer that explains strange and complex concepts to you like not many other people can do. This book goes a step beyond “simple” chaos and shows you how nature manages to synchronise its elemental randomness back into order.
Computers, Pattern, Chaos and Beauty is my favourite of these books. 
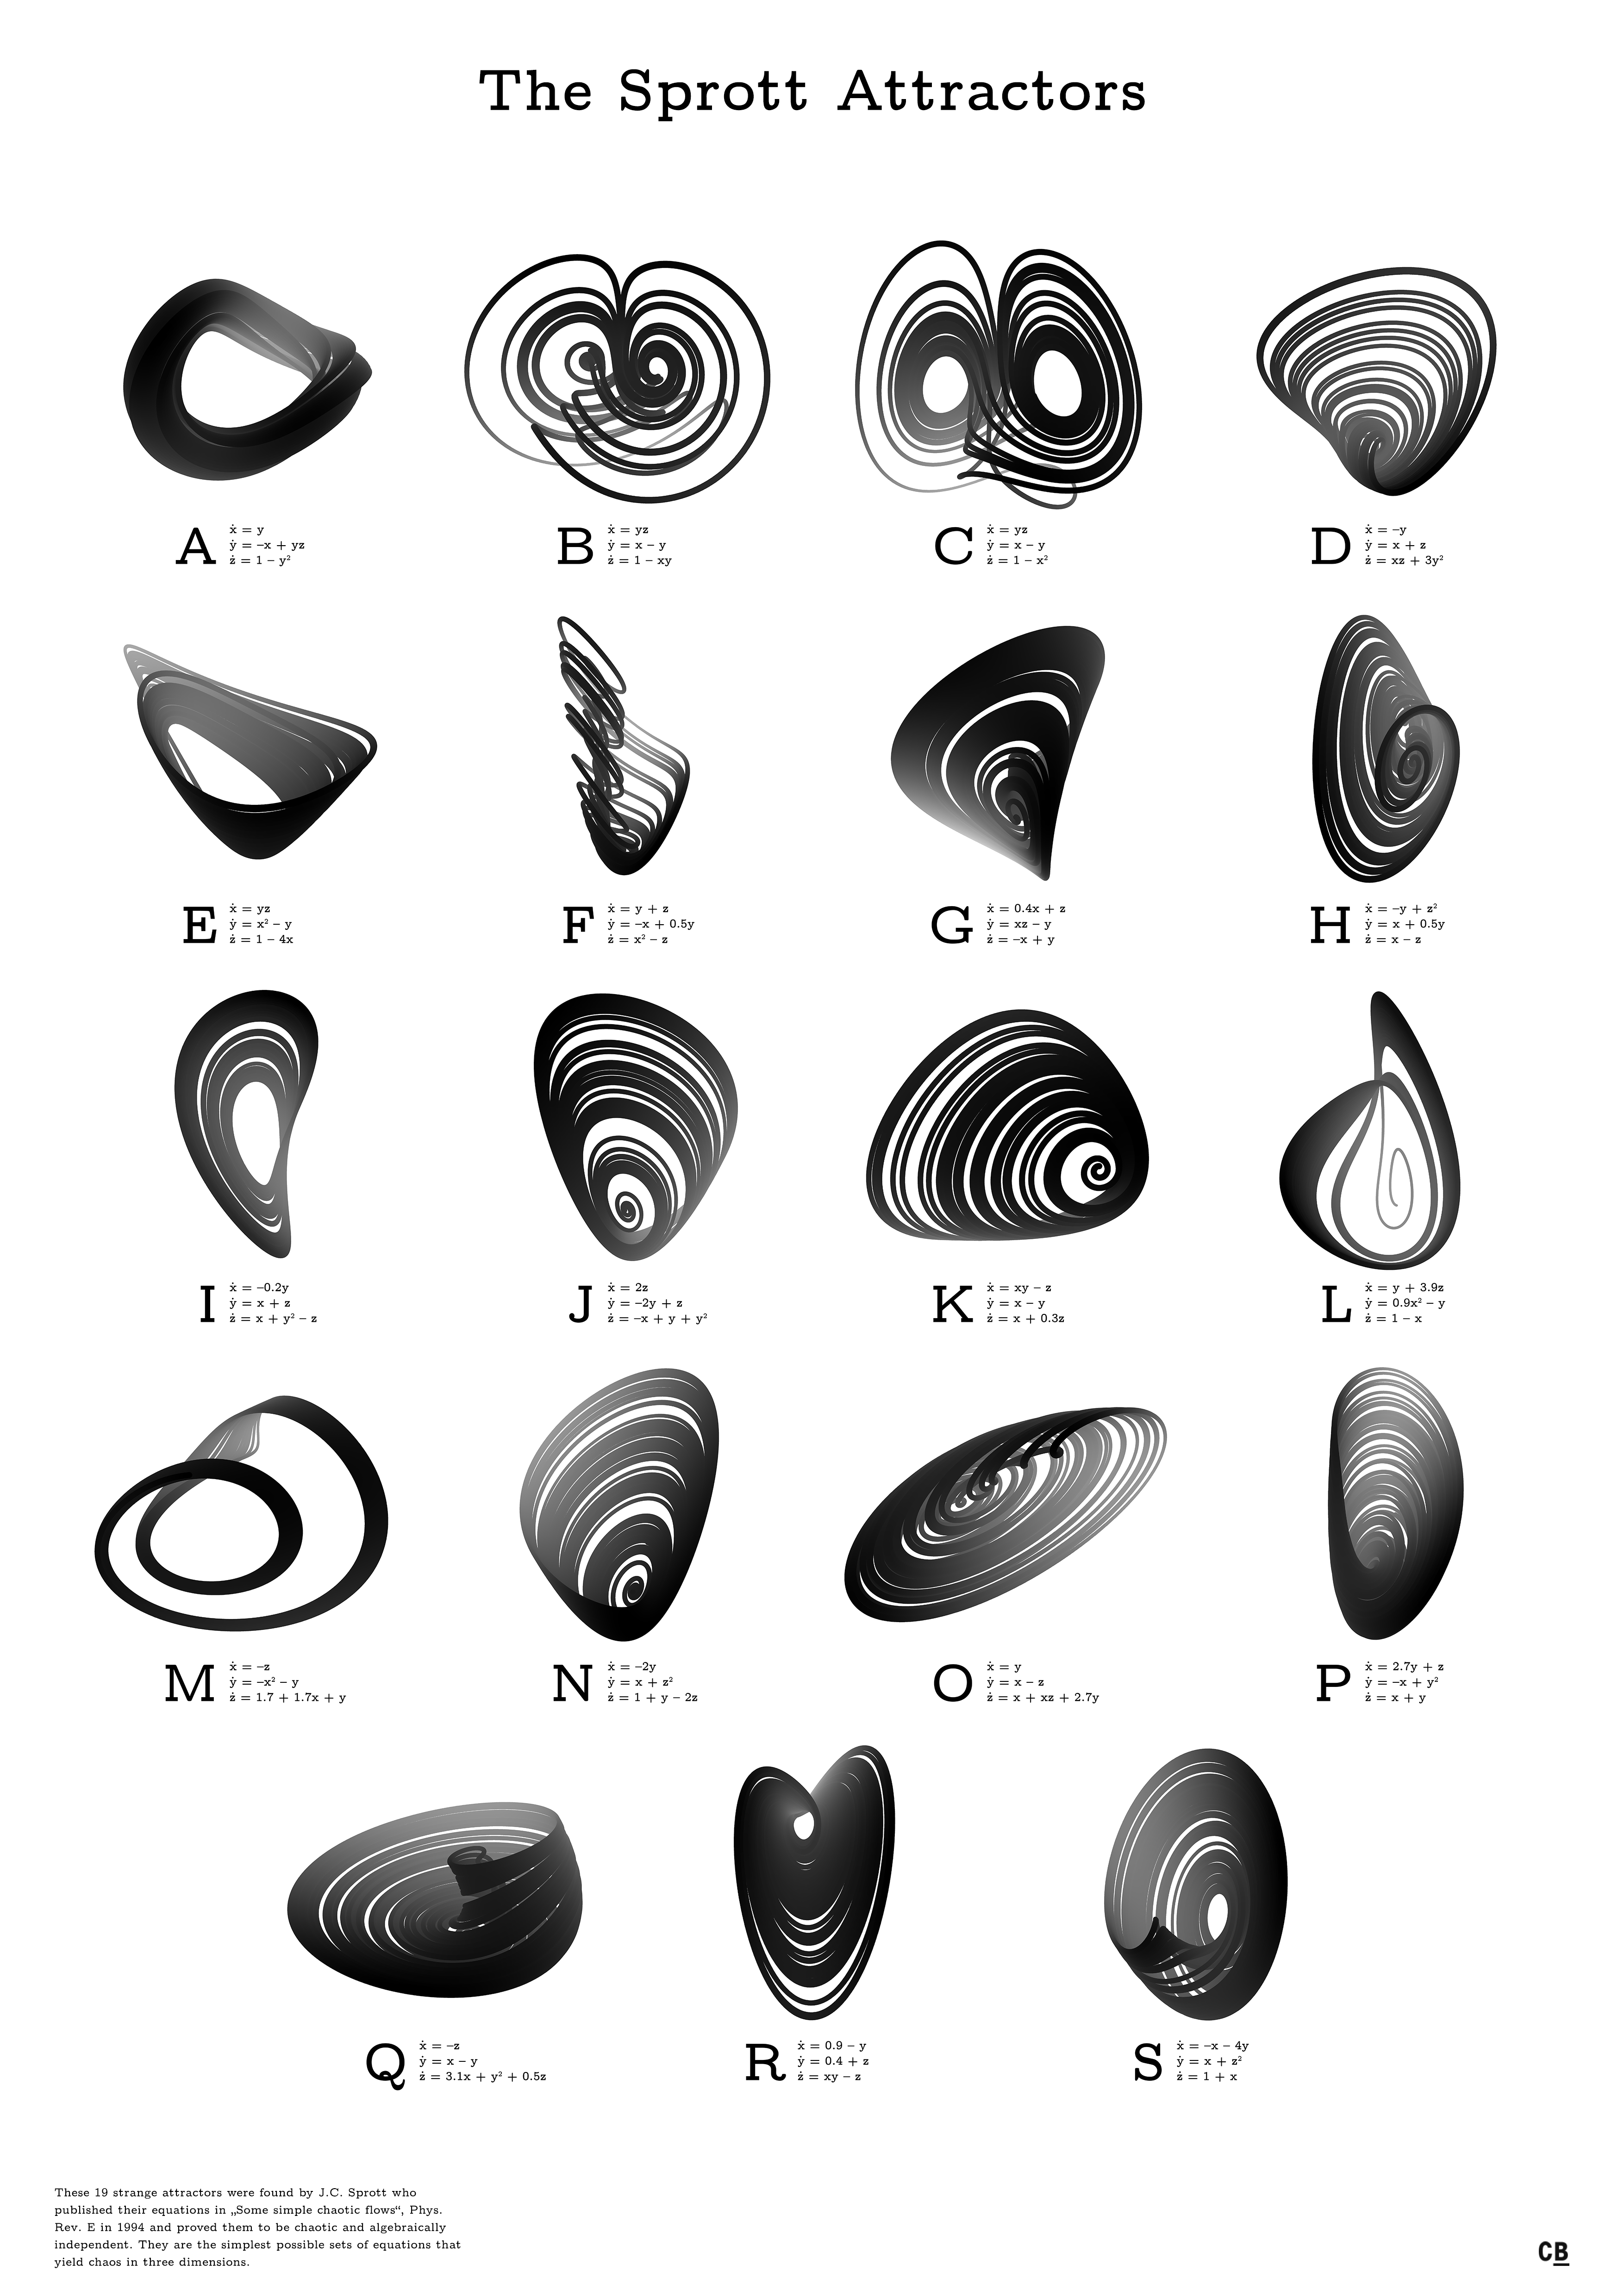
It inspired me to write my own little programs to compute fractal images and attractors renders, which you can also find on my website. Cliff Pickover covers a lot of rather untypical topics and tells more about their mathematical background, but also provides some useful pseudocode algorithms.
Detailed and highly in-depth descriptions of fractal rendering methods and algorithms. Eight specialized researchers bring together their knowledge about all important aspects of the simulation and modelling of fractal growth, generation of random as well as deterministic fractals and patterns and show how to create digital representations of nature based on the science of fractals. Many pseudocodes are included.
This could also be included in the Picture Books section, because this book contains a large collection of renders of two- and more-dimensional strange attractors. But in addition to that, each model is explained in great detail and BASIC program codes are provided you can run on your own PC. Although, this book and its programs are old, one can learn a lot of computer-science and mathematics from them.
Relatively little focus on chaos theory itself, but a great support for understanding how a system becomes dynamic and what types of systems there are scattered across different fields of mathematics. This basic knowledge helps to understand more advanced theories discussed in more specialised books.
In my opinion, the standard work in this field. With this, you get over 800 pages of condensed knowledge about basically every aspect of chaos theory. The beauty you’ll find in this book is not necessarily in visually appealing images, but in the mathematics of this enthralling science.
Possibly the greatest and single most important publication about fractal images and what this field in mathematics is about. Benoît Mandelbrot himself shows every aspect of fractals he knew at the time and draws a connection between them. Depending on the edition, this book might cost you a fortune.
Actually beautiful and high-quality pictures of fractals and chaotic objects in a large-format book with great explanations of what is depicted and some theory behind it.
A great timeline of important discoveries in mathematics. From 150 Million B.C. to 2007, Cliff Pickover shows 250 milestones with a great image and provides a short summary of what it is about and why it was important. The hardback edition is particularly nice to flip through.
]]>Anyway, because this year’s Pi-Day was just around the corner, I wanted to create some stereograms with \(\pi\)-inspired motifs. But heck, creating patterns that first of all look nice and secondly fit the magic requirements turned out to be very difficult3. I eventually gave up on that idea (so, no Pi things this time) but I was still struck by the amazingly simple working principle of stereograms.4
After I clearly understood how they work and what properties work better than others, I still needed good motifs. Those typical ones – cubes, hearts, trumpets, or similar simple objects – were too low level for my demands, especially if I don’t even have a pattern to hide them. But then I remembered that I always wanted to get a more profound feeling of the attractors5. I calculated them, I manipulated them, I interacted with them in 3D software and I even printed large renders of them onto paper – but none of that gave me a true feeling of their three differential equations.
So, here I ended up creating very non-magical-looking 3D images that are two 2D images unless you perform weird eye movements.
Here is a “training” image for you, if you are not familiar with how stereograms work:
All you have to do is to look through the screen as if you focus a distant object behind it. Make your eyes independently leave the single spot you currently look at somewhere on the screen and let them wander apart. Imagine firing lasers from your eyes, but those lasers have to shoot parallel to each other and not cross in front of the screen.
If you manage to do it, you get an odd feeling and see everything double at first. The two red dots will help you to move your eyes the right amount; each of the dots will split into two (now four dots in total) which then move further apart the more you “stretch” your eyes. The middle two dots will come closer to each other, while the outer ones move away. Now, try to align those two middle dots (right dot that emerged from the original left dot and the left dot which emerged from the right one). Aligning the dots can help to fixate your sight, and you can try to carefully look around without changing your eye’s relative position.
You are ready for what comes next if you can see that there now appear to be three dots in total – a middle one consisting of the two ones you aligned before, one further on the left, and one on the right of it. If you have problems fully aligning the dots, the image might be displayed too large, so scale down this website (about 10 cm between the dots is ideal); or your head is slightly tilted.
The following renders are not just images, but animations of some selected attractors rotating in space. In reality, the lines representing the trajectories should be very thin. I have given them thickness and an initial sense of depth by adding a shading depending on how far away the lines are. The two red dots are also included so that you get your eyes fixated easier. Please adjust the website’s scale if necessary.
If you do everything correct, you should be able to see the attractor that appears to pop out of the screen in the middle of each animation6. You should get a very strong, almost hologram-like feeling of three dimensions that is intensified by the slow rotation. Enjoy!
I hope this little series has given you goosebumps and joy just as it has me. It is a bit challenging to adapt the eye movements, but getting used to it is really rewarding. Finally seeing the attractors in actual 3D7 revealed their beauty in a very pure form.
There will probably be more animations and more attractor renders in the future, so I’m going to update the according page in my gallery here. There, you can also read more about chaos and find the precise equations and parameters I have used.
Have a great Pi-Day (or whatever-day you are reading this on) and take care, Bob.
Wikipedia has a detailed article about how they function and how clever patterns can increase the effects. ↩
It might be the case that it is actually impossible for you to see the 3D images. If you only have one functioning eye, amblyopia, or if you are stereoblind because of other reasons, you are sadly not able to see the effect. ↩
I could have taken the lazy route and use random dot patterns, but those are not very exciting and only act as a kind of magic curtain to hide the object from plain sight. ↩
Jürgen Köller shows more viewing techniques and nicely explains, how you can even draw simple stereograms by hand. ↩
If you look at stereograms more frequently, you should be able to even focus correctly such that the attractors appear very sharp. Your brain is used to focus your lenses in accordance with your eye’s movements (the angle between the lasers you shoot), so focussing on the near screen whilst preserving an eye fixation that is normal for faraway objects can be hard. ↩
Technically, it is the pretty much the same thing as if your brain would process what your eyes see when looking at a real object. The key here is to provide a slightly shifted and rotated image for the right eye. Virtual reality goggles do the same to trick your brain – but these autostereograms are even cooler, as you don’t need any additional tools! ↩
You internet-savvy folks are probably familiar with those oh-so-relevant unboxing videos. They are the entry point for every tech youtuber and just as much for kids dreaming to find a new high-end gaming setup under the Christmas tree. It seems, at least according to those videos, that the packaging containing the tech item is of great importance. Not only is the box cinematically presented, when opening it up, the product (the video is said to be about) is removed and laid aside, often even moved out of the frame! The camera zooms onto the now mostly empty box, which is then shown in more detail. It is rotated, flaps are lifted, cards are extracted, welcoming messages are read, packaging inserts are removed, booklets are flicked through, more flaps are lifted, cables are found, foils are peeled off, adapters are unwrapped, and so on and so forth. You get what I’m saying.
Though I’m not talking about the videos about the box but the gorram box itself. Who on earth thought this would be a good idea?! Who thought that a handful of videos on YouTube glorifying the packaging would justify this?! Let me show you an example. Recently, I was rummaging in my drawers and containers for old and unused things I could get rid of. Ended up in a big, unfunny clean-out. I found several books, DVDs, etc. I could give away to a second-hand. Among the items was a Google Chromecast (generation 2 from 2015) but just the box of it and I remembered that I have given it to a friend some time ago. So I could easily recycle the package – at least I thought so.
Let me present to you the parts that make up a Chromecast box:
Can someone please explain to me why, in the name of Boximus Prime, a small $35 device has to be packaged in something that is more complicated to assemble than the device itself? 24 parts! At least seven different materials. Most of them having a weird non-universal shape with tons of cutouts. Each of them glued together so strongly that I had serious trouble ripping it apart. This is so totally bunkus that I couldn’t find words for the two days I have this laid down on my floor.
Here is a description in more detail:
Now let that sink in. What I described is not a bomb that blows up when one cable comes loose and jiggles a bit. It is also no warehouse crate that carries 200 kg of goods and has to withstand rough handling. It is not even the fancy gift box of a wristwatch costing several grand. No, it’s the throw-away packaging of a cheap small device designed to sit untouched and unseen for years behind the TV of hundreds of thousands of people. I wouldn’t be surprised if the supply chain for the box itself is equally long as that for the Chromecast. And you wonder about climate change being unstoppable. Utterly disgusting.
As a significant portion of consumer electronics is purchased online1, I wonder why the online shops almost never show the packaging. Why spend resources, energy, money and time for the elaborate production of a product box that doesn’t even contribute to the customer’s purchase decision? Why construct a box that consists of complexly folded paper compartments, foils and plastic parts that are easily damaged and make reuse of it impossible when the device is returned to the seller? Why not simply encase them in a blank cardboard box with a simple crumpled paper padding and include a card saying “Hey dear customer, please don’t be disappointed by this uncreative package. It is eco-friendly while perfectly doing its job of protecting the device.” The products themselves are wasteful enough, so why the hell do their packages need to be so multipartite that they require an entire assembly line on their own? I’m sure that there are clever people that can design something less unnecessary than this.
I could definitely continue this rant over several more paragraphs, but I don’t want to strain your precious time too much. So, I hope that you pay a little more attention to the ongoing waste of resources, which is certainly not as far away from the customers as many believe. Also, because this will probably be my last post this year, I already wish you a happy end-of-the-year with whatever, if any, feast you are celebrating.
Take care, Bob.
Some say it was a major re-orientation, some say that too little has changed. I’m of the latter fraction, and not just because of the sole reason that almost a quarter of voters either didn’t care if the resulting chancellor would be an absolute retard or didn’t recognise how plain stupid he is. Both cases raise concern for me. But why did it happen? Well probably a mix of ignorance, tradition, change aversion and something we call “Nationalstolz”. Now, the retard didn’t win the election, but he still wants to become chancellor! Just like the American guy, he doesn’t accept his failure and nags around, digging for arguments. Disgusting.
I completed a few of my last study modules, like complex thermal separations, process automation and economy. Economy? Oh dear, I had to write a lengthy essay and I hated it. But the trickster that I am has found a workaround by taking ExxonMobil as an example of dirty petrol industry, unethical exploitation of Third World countries and decades-long climate change denial. All of which I pretended to just be interested in because of economical effects – absolutely not the case.
They are in this gallery and if you don’t know what I’m talking about, read my posts here and here.
Recently, I got my hands on a copy of Clifford Pickover’s great book “Computers, Pattern, Chaos and Beauty”. The urge desire to replicate the contained beautiful images resulted in several days coffee-only diet and not taking my eyes off the screen or scribble paper for longer than absolutely necessary. You can find some of the graphics I generated here.
I also started reading books from the Revelation Space universe by Alastair Reynolds – huge fan of it! After finishing “Revelation Space”, I continued with “Redemption Ark” and while I was waiting for the next books to arrive, the novel collection “Diamond Dogs and Turqoise Days” was a quick read. Next up will be “Chasm City” for me which is not the third book of the original trilogy but I couldn’t find a nearby seller who has the correct edition of “Absolution Gap” in stock. Yes, I like to have matching versions in my shelf, and I’d rather wait or pay more than taking a copy that is visually completely different. So, 2000 pages in and roughly 3300 ahead of me – I’m excited.
]]>I’m not drawing digital paintings myself, but my attractor renders could be considered digital art. Maybe not oh so creative or original, but it’s art. Clean, minimalistic, modern, a bit heavy on maths, so yes, kind of. So, why not bump up the resolution and print it? It’s fairly simple to do, as the actual scene and model didn’t change much. Okay, call it cheating because other artists can’t easily scale up their paintings and it might be a lot more work to draw otherwise unseen details. For me, only rendering time jumped into unmanageable extends, but a kind friend helped me out and donated a full day of his precious computing power to produce a 15 MP image of the Nosé-Hoover Attractor, so that I could print it half a metre wide on Hahnemühle fine-art paper.
And today it arrived:
Framed and hung up on the wall, I just can’t take my eyes off it:
I think it turned out wonderfully. Oh, and one last thing before you email me: No, it will not be available for sale.
]]>At first, it might seem normal, but look at the out-of-focus parts more closely:
They aren’t all that smooth as they should, right? It is largely because of the bad optical properties of the phone’s lenses, but it’s made even more present because of colour clamping. That is a phenomenon where part of an originally smooth colour gradient is cut off and replaced by the outermost colour that is still within the allowed range. I’ve tried to simulate this here:
Both are a simple linear gradient from one colour to another, but in the second image I have chosen a “maximum” value for the left colour. This is as if the original left colour is not possible to display and is thus clamped to the last one that is. As you can (hopefully) see, the rest of the gradient did not change but the transition from possible colours to impossible colours suddenly looks sharper – because there is nothing for the eye to continue with. The transition is located at about 1/3 of the gradient’s width.
What I’m showing there is not what actually happens with the photos, but the effect is visually similar – I just wanted you to clearly see what I’m talking about. Also, it is not “banding” if you had that in mind. Banding is caused by low bit-depth, which limits the possible colour values overall and leads to stripy gradients.
Ok, let’s get back to the flower image. I have set up the phone to save a RAW file of the image next to the usual JPG you have seen above. RAW in this case means plain and unprocessed data which is not bound to any colour space – just limited by the physical possibilities of the camera sensor. The result1 looks a bit different and not as vibrant as the JPG:
Let me explain why that is and what happens, when the camera converts the captured RAW into a JPG. For that you’ll have to know a bit about colour spaces, so here is a graph2 you have probably seen before somewhere:
You can ignore the axes, but the rainbowy horseshoe is very important. In fact, all colours of the rainbow and thus the entire visible spectrum are located right at the edge of the shape – the wavelengths \(\lambda\) in nanometres are annotated. Everything else apart from the horseshoe’s edge is not pure light but a mix of different wavelengths.3
Now the not so fun part begins: The colours you see are not even the actual colours described by the diagram. What? Yes, confusing, but it is just because your display can’t depict them. Maybe you can spot a weird triangle within the horseshoe that looks a bit brighter than the rest and has its corners in the blue, green and red area. The triangle’s edge you are seeing is precisely caused by the phenomenon I showed you above with the gradients. Only colours within the triangle are correctly displayed by your screen, everything outside is clamped to a colour that lies on the triangle’s edge. If you look closely (especially visible in the greens), you’ll realise that the colours are not actually changing to any new values. What you are seeing as a triangle is probably close to or a bit less than the sRGB colour space, as most display can’t show more than that. I’ll show the actual boundary of this colour space (called a gamut) in the next graphs.
I have now extracted a list of pixels from both the JPG and the RAW image (about every 2500th pixel) and computed their position inside the colour space diagram.4 Here are the RAW pixels:
You can see several things here: First of all, the image mainly consists of red, yellow and green tones – almost no blues are present. Secondly, oh lord of the flies, there are colours captured that are not even visible to the human eye! The pixels below the horseshoe are from infrared and ultraviolet wavelengths, isn’t that exciting? You’ll find those being emitted by a lot of flowers for insects to see. Above the horseshoe are also some invisible “green” colours, and I’m not entirely sure how you could imagine them, but they clearly form a straight edge – at the camera’s physical limit.
The phone has a problem now because what should it do with those invisible wavelengths it recorded? If it kept them invisible, you’ll get transparent (or black?) areas on the image, and they look weird. Nobody wants holes in his selfie, right? So what the phone does is calculating a colour it could show instead. It is surely using some fancy algorithms I have no idea of but what we can do is look at the outcome:
What a difference! All pixels are now moved inside the sRGB gamut so that everything can be displayed correctly. You’ll also find other previously fine pixels being moved around. That’s because of some editing the phone automatically applied to make the image look better. In order to not being bothered by them, I filtered the pixels and now show only the transformations. In blue, you see the original RAW pixels and in black the same pixels but transformed into the sRGB region; pixels that were previously within sRGB already are not shown:
I find the result quite revealing – you can clearly see how a wide colour gradient was cut off and pushed into the allowed region. The colours are still a bit spread, but their originally smooth variations now ends sharply at the corner of sRGB. This edge is often visible in photos as I showed you in the beginning and I hate it!
Of course, leaving the RAW image as is also doesn’t help as the problematic pixels can’t be shown correctly anyway, but you can edit it in such a way that the colours are not being crammed onto the edge of what’s possible when converting into sRGB – by taking the limited colour space into account. But I will talk about that another time as this post is already a bit lengthy.
PS: Sorry for the longer pause in blog posts, I was busy with my beloved attractors and writing something new takes longer than you might guess. I want to provide fairly accurate content and somehow keep it short but also as interesting as possible for you to enjoy. So, good day and see you later.
The RAW image is not displayed correctly either as it contains colours that are not possible to be shown on your screen or even to be visible by your eye (and it is converted to sRGB for the web anyway). ↩
You might want to read Wikipedia’s article about the CIE 1931 xyY colour space for more details. ↩
If you are looking at this on a screen (or did you print it?!?), you’ll just see pure red, green and blue wavelengths and not yellow wavelengths for example as RGB pixels create a mixture with them. ↩
I used rawpy for pixel extraction, Pillow for image rendering and colour for the colour space plots. You can find the source-code on GistHub. ↩